Zhiran Liang1,2, Blessed Kondowe3, Guoqing Sun1, Tingting Han1, Nabila Abubakar Ibrahim Hassan1, Jiayin Tong1*, Jingping Zhang1
1. Department of Medical Imaging, The First Affiliated Hospital of Xi’an Jiaotong University, 277 Yanta West Road, Xi’an, Shaanxi 710061, P.R. China
2. Department of Radiology, Tianjin Medical University Cancer Institute & Hospital, National Clinical Research Center for Cancer, Tianjin’s Clinical Research Center for Cancer, State Key Laboratory of Druggability Evaluation and Systematic Translational Medicine, Key Laboratory of Cancer Prevention and Therapy, Tianjin 300060, P.R. China
3. Department of Radiology, Mzuzu Central Hospital, P/Bag 209, Luwinga, Mzuzu, Malawi
*Corresponding to: Jiayin Tong, MD.; Department of Medical Imaging, The First Affiliated Hospital of Xi’an Jiaotong University, 277 Yanta West Road, Xi’an, Shaanxi 710061, P.R. China; E-mail: tongjiayin@xjtufh.edu.cn; Phone: +86 15129208392; ORCID: 0009-0002-7205-0894
ABSTRACT
Objectives:
This study aimed to investigate quantitative computed tomography (QCT) imaging features of the airway in patients with adult-onset eosinophilic asthma (EA) and their relationship with clinical parameters.
Methods
A total of 108 subjects were divided into three groups: 35 healthy subjects, 36 EA patients with peripheral blood eosinophil (EOS) ≥0.3 × 10⁹ L-1, and 37 non-eosinophilic asthma (NEA) patients. QCT measurements of the airway and clinical parameters were compared among the three groups. The correlation between QCT measurements and clinical parameters was analyzed using Pearson’s or Spearman’s correlation coefficient, as appropriate.
Results
The EA group was older than the healthy group (P < 0.001). Lumen area (LA)/body surface area (BSA), wall thickness (WT)/√BSA, and wall area (WA)/BSA of the airway were statistically different among the three groups, with LA/BSA, WT/√BSA, and WA/BSA being significantly lower in the EA group than in the healthy group (P < 0.05). The three groups had no significant difference in wall area percentage (WA%). The QCT measurements showed no significant correlation with EOS, whereas a negative correlation was observed between EOS and the forced expiratory volume in 1 second (FEV1) (r = -0.323, P = 0.007).
Conclusion
Patients with adult-onset EA exhibit significant airway stenosis, and QCT measurement is useful for characterizing airway remodeling in this condition. FEV1 may be a more sensitive clinical indicator for evaluating adult-onset EA than QCT measurements.
Keywords: asthma; eosinophilia; tomography, X-ray computed; airway remodeling; bronchi; forced expiratory volume
Introduction
Asthma is a heterogeneous disease characterized by chronic airway inflammation1,2. Inflammation is mediated by multiple cell types, among which eosinophil (EOS) plays an essential role in the pathophysiology of asthma3-5. By releasing a cascade of inflammatory mediators and engaging in intricate interactions with mast cells and epithelial cells, EOS actively contributes to perpetuating chronic inflammation and subsequent airway remodeling3,6-8. Studies have identified that airway remodeling induced by EOS includes airway epithelium damage, reticular subbasement, membrane thickening, and airway smooth muscle remodeling6,7,9.
Adult-onset eosinophilic asthma (EA) is currently recognized as one of the most severe and challenging-to-manage phenotypes3,10-12. This particular subtype of asthma typically presents with a heightened level of eosinophilic airway inflammation despite the administration of oral corticosteroid therapy, persistent airflow limitation, an increased risk of severe exacerbations, and an unfavorable prognosis10,13. However, several eosinophil-targeting biologic therapies (e.g., benralizumab, mepolizumab) have been developed and shown efficacy in managing this specific asthma subtype 11,14-17. Therefore, early recognition of this subtype of asthma is essential.
Currently, quantitative computed tomography (QCT) is widely utilized as a non-invasive tool to investigate airway remodeling in asthma8,18-21. Previous studies have demonstrated that asthmatic patients may experience airway lumen narrowing and airway wall thickening as the disease progresses19,20. However, there is limited research on QCT imaging features of adult-onset EA, and further investigation is needed to clarify the airway remodeling pattern of this subtype of asthma. In this study, we compared QCT imaging features and clinical parameters among adult-onset EA patients, non-eosinophilic asthma (NEA) patients, and healthy individuals and analyzed the correlation between QCT measurements of the airway and clinical parameters.
Materials and Methods
Study Design and Subjects
From March 2020 to February 2021, two hundred and fifty-three subjects were consecutively recruited from the “Digital Lung” Respiratory Disease Evaluation System and Diagnostic Criteria (201402013), a multi-center database. The diagnosis of asthma (age ≥ 18 years at diagnosis) was confirmed by experienced pulmonologists according to the criteria of the Global Initiative for Asthma (GINA) 2020 guidelines22. It was ensured that asthma patients had not experienced exacerbations or respiratory infections for a minimum of four weeks prior to participation. Healthy subjects (age ≥ 18 years) were consecutively recruited during the same study period and were confirmed to have no history of respiratory symptoms or diseases, as well as normal chest CT and pulmonary function. Among them, 74 subjects were excluded: asthmatic patients with complications (e.g., chronic obstructive pulmonary disease (COPD), bronchiectasis, pulmonary interstitial fibrosis) and healthy subjects with abnormal chest CT findings. Another 71 subjects were excluded due to poor breathing coordination resulting in inadequate image quality or incomplete bronchial auto-segmentation. Finally, a total of 73 adult-onset asthmatic patients and 35 healthy subjects were included in this study. Among them, asthma patients were further stratified into two groups based on whether their peripheral blood EOS differential count was higher than 0.3 × 10⁹ L-1: the EA group (n = 36) and the NEA group (n = 37) (Figure 1). The subjects’ clinical parameters were obtained from medical records at enrollment, and all underwent peripheral blood EOS analysis, deep inspiratory chest computed tomography (CT) scan, and pulmonary function tests (PFTs). This study was conducted in accordance with the Declaration of Helsinki and was approved by the local ethics committee [approval number: KYLLSL201312202]. Prior to enrollment, all subjects provided written informed consent after being fully informed.
Full Blood Count Analysis
The peripheral blood cell count measurement was conducted a day before the CT examination, and the absolute counts of EOS and neutrophils (NEU) were documented.
Chest CT Analysis
All CT scans were performed using 64-slice or higher scanners with a standard high-resolution computed tomography (HRCT) protocol (1mm slice thickness, 1mm interval, 120 kVp, automatic tube current, 0.8 seconds rotation time). Patients were scanned in the supine position while holding their breath at maximal inspiration. No contrast material was used. The images were reconstructed using a bone algorithm with a 1024 × 1024 matrix and a small field of view specifically targeted to image pulmonary areas.
The volumetric chest CT data were transferred to the FACT-Digital Lung analysis platform, and after fully automatic segmentation and reconstruction, a three-dimensional bronchial tree was obtained. The following parameters of the right upper lobe apical segmental bronchi (RB1), left upper lobe apicoposterior segmental bronchi (LB1+2), right lower lobe posterior basal segmental bronchi (RB10), and left lower lobe posterior basal segmental bronchi (LB10) were measured and recorded: lumen area (LA), wall thickness (WT), wall area (WA), and WA%. The mean values of LA, WT, WA, and WA% for the four bronchi were then calculated. Besides, to reduce the influence of body surface area (BSA), the correction values of the parameters were calculated, that is, LA/BSA, WT/√BSA, and WA/BSA, respectively.
Pulmonary Function Tests
Pulmonary function tests (PFTs) were performed within three days after the CT examination. The forced expiratory volume in 1 second (FEV1), the ratio of forced expiratory volume in 1 second over forced vital capacity (FEV1/FVC), total lung capacity (TLC), vital capacity (VC), functional residual capacity (FRC), residual volume (RV), the ratio of residual volume to total lung capacity (RV/TLC), and maximal expiratory flow at 50% of forced vital capacity (MEF50%) were mainly measured and recorded.
Statistical Analysis
The normality of continuous data was assessed using the Shapiro-Wilk test, and homogeneity of variances was examined using Levene’s test. Based on these results, one-way ANOVA or the Kruskal-Wallis rank sum test was used for comparisons among the three groups as appropriate. The chi-square test was used for categorical variables. Post hoc pairwise comparisons were conducted as appropriate. An independent samples t-test was conducted to compare measurements between the EA and NEA groups. Pearson and Spearman correlation coefficient tests were performed to examine the associations among clinical parameters, QCT measurements, and EOS. A P value of < 0.05 was considered statistically significant. All analyses were carried out using IBM SPSS Statistics software (version 20.0).
Results
Clinical Characteristics
The baseline demographics and clinical parameters of EA patients, NEA patients, and healthy subjects are shown in Table 1. Patients with EA were older than healthy subjects (P < 0.001) and had higher peripheral blood EOS counts than the NEA patients (P < 0.001). There were no significant differences in gender and body mass index (BMI) among the three groups. No significant difference was found in asthma duration, FEV1/FVC, and NEU between the two asthmatic groups. The FEV1 of the EA group was lower than that of the NEA group, with borderline statistical significance (P = 0.050).
Table 1. The baseline demographics and clinical parameters of EA patients, NEA patients, and healthy subjects
| Mean (SD) | ||||
| Control (n = 35) | EA (n = 36) | NEA (n = 37) | P value | |
| Background information | ||||
| Age (years) | 53.37(10.26) | 62.61(11.13) | 58.22(10.72) | <0.001*† |
| Gender (%males) | 54.3 | 58.3 | 54.1 | 0.919 |
| BMI (kg/m2) | 23.65(1.51) | 22.99(2.33) | 22.59(1.95) | 0.162 |
| Asthma duration (year) | NA. | 6.22(8.44) | 4.92(4.77) | 0.419 |
| Eosinophil | NA. | 1.09(1.67) | 0.10(0.09) | <0.001‡ |
| Neutrophil | NA. | 5.14(2.63) | 4.81(2.32) | 0.578 |
| Spirometric values | NA. | |||
| FEV1 (% predicted) | NA. | 60.08(18.78) | 69.23(12.01) | 0.050 |
| FEV1/FVC (%) | NA. | 67.13(10.30) | 69.50(11.59) | 0.359 |
Abbreviations: EA, eosinophilic asthma; NEA, non-eosinophilic asthma; SD, standard deviation; FEV1, the forced expiratory volume in 1 second; FEV1/FVC, the ratio of forced expiratory volume in 1 second over forced vital capacity; NA., Not Applicable.
Note: *, P < 0.05 for one-way ANOVA analysis among the three groups. †, P < 0.05 for EA patients vs. healthy subjects. ‡, P < 0.05 for EA patients vs. NEA patients.
Table 2. Comparisons of QCT measurements among EA patients, NEA patients, and healthy subjects
| Mean (SD) | ||||
| Control (n = 35) | EA (n = 36) | NEA (n = 37) | P value | |
| LA/BSA | 17.18(5.48) | 13.53(6.67) | 14.59(4.10) | 0.006*† |
| WT/√BSA | 1.12(0.15) | 1.03(0.18) | 1.12(0.21) | 0.030*† |
| WA/BSA | 20.69(5.43) | 16.44(5.80) | 18.49(4.94) | 0.001*† |
| WA% | 55.66(3.96) | 57.31(7.16) | 57.14(5.44) | 0.409 |
Abbreviations: SD, standard deviation; EA, eosinophilic asthma; NEA, non-eosinophilic asthma; LA, lumen area; WT, wall thickness; WA, wall area; WA%, wall area percentage; BSA, body surface area. Note: *, P < 0.05 for one-way ANOVA analysis among the three groups. †, P < 0.05 for EA patients vs. healthy subjects.
Comparisons of QCT Measurements
There was a statistically significant difference in LA/BSA, WT/√BSA, and WA/BSA among the three groups (Table 2 and Figure 2). Patients with EA showed lower LA/BSA, WT/√BSA, and WA/BSA than the healthy group (P < 0.05). LA/BSA exhibited a progressive decline from healthy subjects to NEA patients and then to EA patients; however, only the difference between the EA group and the healthy group was statistically significant. There was no significant difference in WA% among the three groups. The representative examples of three-dimensional bronchial segmentation from each group are illustrated in Figure 3.
Correlation of QCT Measurements with Clinical Parameters
In asthmatic patients, LA/BSA, WT/√BSA, and WA/BSA were negatively correlated with BMI (r = -0.469, -0.418, and -0.580, respectively), and there was a positive correlation between WA% and duration (r = 0.267), as shown in Figure 4. No significant correlation was found between EOS and QCT measurements. There was a negative correlation between EOS and FEV1 (r = -0.323, P = 0.007), as presented in Figure 5.
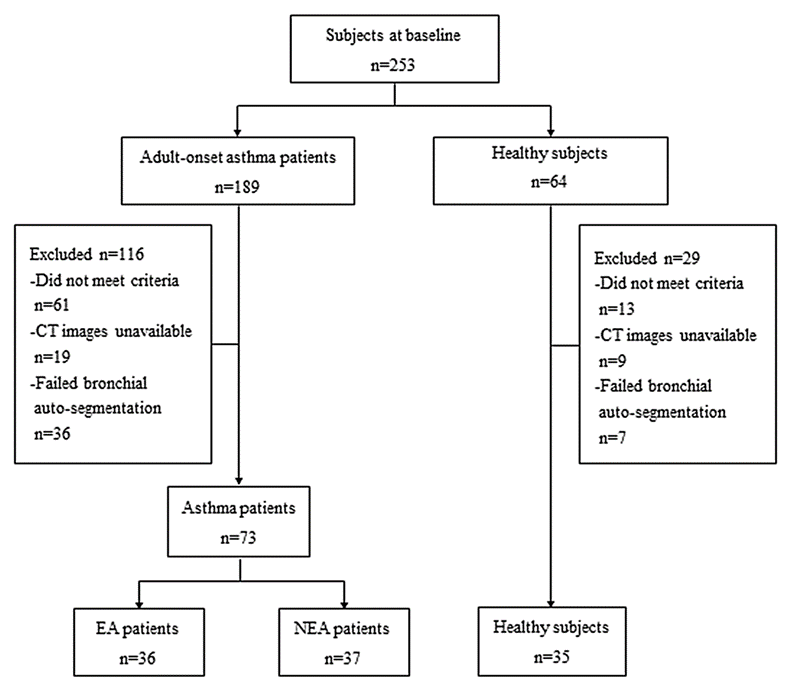
Figure 1. Study flowchart. EA, eosinophilic asthma; NEA, non-eosinophilic asthma.
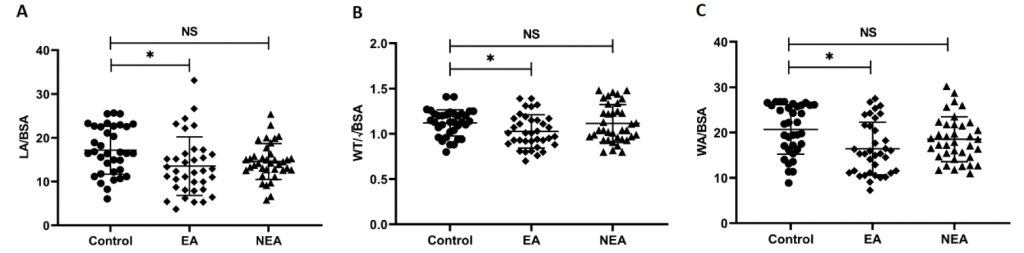
Figure 2. Comparisons of QCT measurements among the three groups. EA, eosinophilic asthma; NEA, non-eosinophilic asthma; LA, lumen area; BSA, body surface area; WT, wall thickness; WA, wall area; NS, non-significant.
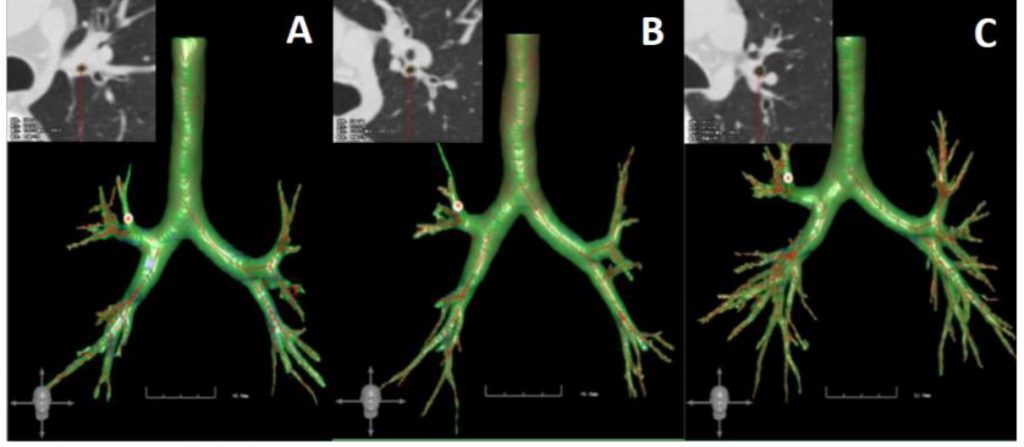
Figure 3. Representative three-dimensional bronchial segmentation examples of each group. A, eosinophilic asthma patient; B, non-eosinophilic asthma patient; C, healthy subject.
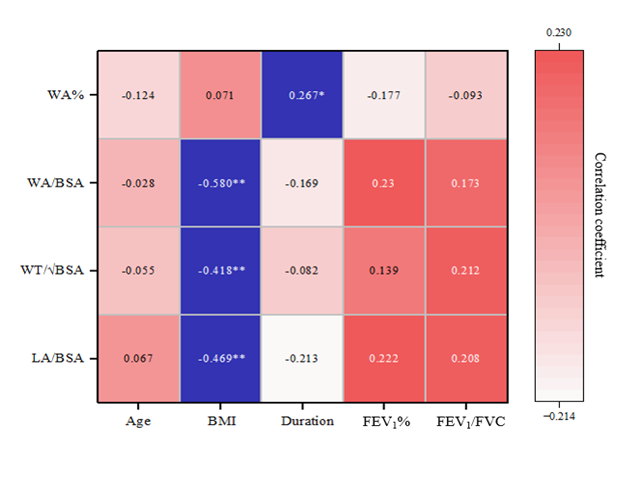
Figure 4. Correlations of QCT measurements with clinical parameters in asthmatic patients. WA%, wall area percentage; WA, wall area; BSA, body surface area; WT, wall thickness; LA, lumen area; BMI, body mass index; FEV1, the forced expiratory volume in 1 second; FEV1/FVC, the ratio of forced expiratory volume in 1 second over forced vital capacity.
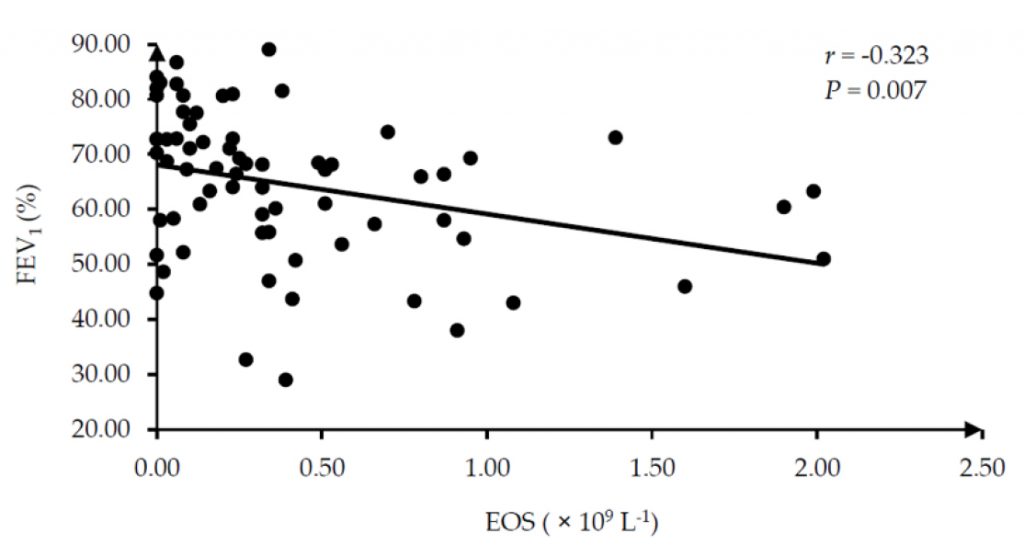
Figure 5. Correlation between EOS and FEV1 in asthmatic patients. EOS, eosinophil; FEV1, the forced expiratory volume in 1 second.
Discussion
In this study, we observed that patients with adult-onset EA tend to exhibit advanced age and bronchial luminal narrowing compared to healthy individuals. No significant differences were observed in either the clinical parameters or QCT measurements between patients with EA and NEA. FEV1 showed a significant negative correlation with EOS in asthmatic patients.
The findings of previous studies suggest that asthmatic patients with prominent eosinophilic inflammation represent a severe subtype of asthma2,10,13. Numerous studies have been conducted to further improve the diagnostic accuracy of EA to elucidate both the clinical manifestations and airway remodeling features associated with this particular type of asthma. However, there are discrepancies in these findings, particularly regarding the airway remodeling features of EA. In this study, we initially compared the clinical features of the subjects and found that EA patients exhibited a higher mean age in comparison to healthy subjects. Additionally, although the difference in FEV1 between the two groups of asthmatic patients was of borderline statistical significance (P = 0.050), there was a tendency for lower FEV1 values in the EA group when compared to the NEA group. The present finding is consistent with prior research by de Groot et al.13 who reported that patients with EA tend to be older compared to those with NEA and are more frequently associated with poorer pulmonary function and airflow limitation. Flinkman et al.2 observed a more pronounced deterioration in pulmonary function among patients with EA. Similarly, the study conducted by Inoue et al.23 examined the disparity between EA and NEA patients, concluding that EA patients exhibit lower FEV1 levels compared to NEA patients. However, it is important to note that our study found no statistically significant difference between these two groups, which could be attributed to the relatively limited sample size. Overall, these findings suggest that FEV1 has the potential to serve as an effective clinical indicator for evaluating adult-onset EA.
For the analysis of airway remodeling, significant differences were observed in LA/BSA, WT/√BSA, and WA/BSA among the three groups, with all three QCT measurements in the EA group being lower than those of the healthy group. Although no significant difference was observed between the EA and NEA groups, the LA/BSA exhibited a noticeable declining trend from healthy subjects to NEA patients and then to EA patients. The findings suggest a possible association between higher EOS levels and greater airway constriction, although this requires further validation. Inoue et al.23 quantitatively evaluated the airway remodeling of asthmatic patients, and they also concluded that the LA of EA patients was smaller than that of NEA patients. On the other hand, no significant difference among the three groups was found in our study’s assessment of airway wall thickness. Alagha et al.24 compared the wall thickness between EA and NEA patients and found no significant difference between the two groups, concluding that asthma patients with high EOS counts are not accompanied by proximal airway remodeling. In contrast to our findings, Inoue et al.23 reported that WA% and WT/√BSA were larger in EA patients than in NEA patients. In our study, both WT/√BSA and WA/BSA were even lower in the EA group than in the healthy group. Previously, several studies have observed airway wall thickening in asthmatic patients8,19,20,25. This remodeling is related to increased subepithelial membrane thickness, goblet cell hyperplasia, mucous gland hypertrophy, smooth muscle hypertrophy, and/or hyperplasia26,27. However, these findings should be interpreted with caution due to the relatively small sample size and limited software measurement accuracy. Beyond these two limitations, several factors may explain this counterintuitive finding. First, adult-onset EA may involve predominant airway smooth muscle contraction rather than overt wall thickening, especially during deep inspiratory CT scanning. Severe eosinophilic inflammation could induce bronchoconstriction and luminal narrowing without proportionally increasing wall thickness in central airways. Second, scanning at full inspiration may distend the airway wall and mask mild thickening, particularly in patients with high airway reactivity. Third, eosinophilic inflammation may drive more prominent remodeling in small peripheral airways rather than the larger bronchi evaluated here, leading to lower measured wall parameters in central airways. These factors collectively highlight the complex, phenotype-specific nature of airway remodeling in adult-onset EA.
Furthermore, correlation analysis was performed among QCT measurements, clinical data, and EOS to determine the possible clinical factors influencing airway inflammation and remodeling and potential imaging biomarkers for EA. No correlation was found between age and EOS or airway remodeling. Duration showed a positive correlation with WA%, suggesting that airway thickness increases with disease progression. For the correlation analysis between EOS and clinical indicators, we found that EOS showed a negative correlation with FEV1. Our results were in line with a previous study by Flinkman et al.2 who discovered a correlation between high peripheral blood EOS levels and a greater decline in pulmonary function among asthma patients. Backman et al.28 suggested that the decline in FEV1 among asthmatic patients is associated with their peripheral blood EOS levels. Our results further indicated that FEV1 might be a specific indicator for the clinical evaluation of adult-onset EA patients.
Induced sputum inflammatory cell count is the gold standard for defining asthma inflammatory phenotype29. However, the inspection operation and procedure of this examination are complicated, many factors influence the results, and there are also safety concerns. In recent years, many researchers began to explore the level of peripheral blood granulocytes in patients with asthma, and they found that peripheral blood EOS was positively correlated with induced sputum EOS3,29,30. In addition, with a reported receiver operating characteristic area under the curve (ROC AUC) of 89%, Wagener et al.31 pointed out that blood eosinophilia is an accurate surrogate marker for sputum eosinophils. However, there is still no unified standard to define EA patients with their peripheral blood EOS levels so far. Zhang et al.29 compared peripheral blood EOS counts and induced sputum EOS in defining EA and found that both parameters were good predictors. In their study, the AUC value of ROC for peripheral blood EOS counts was 0.898, and the best threshold was 0.26 × 10⁹ L-1. Besides, in recent studies, peripheral blood EOS counts were widely used to diagnose EA with a cut-off of 0.3 × 10⁹ L-1 2,15,32,33. Therefore, we finally chose the 0.3 × 10⁹ L-1 cut-off to divide EA and NEA patients.
There are several limitations in this study. First, although our study provides important insights into airway QCT features in adult‑onset EA, the relatively small sample size (36 EA, 37 NEA, and 35 healthy subjects) may limit the external generalizability of the findings. Future large‑sample, multicenter studies are needed to confirm and extend our observations. Second, only four segmental bronchi (RB1, LB1+2, RB10, LB10) were quantitatively analyzed. These may not fully represent the global or whole‑airway remodeling pattern, particularly in smaller peripheral airways, which could exhibit different remodeling characteristics in EA. Future studies with comprehensive whole‑airway analysis covering more bronchial generations and segments are warranted. Third, all CT scans were acquired at full inspiration; expiratory phase CT was not performed. This limits the assessment of dynamic airway collapse or air trapping, which could provide additional functional information. Fourth, although we used a standardized scan protocol across participating centers to minimize technical variability, differences in CT scanners remain a potential source of bias.
Conclusion
In conclusion, adult-onset EA is characterized by late onset, significant airway stenosis on QCT, and severe airflow restriction. QCT is useful for characterizing airway remodeling in this asthma subtype. LA/BSA may serve as a candidate imaging biomarker that warrants further validation. FEV1 may be a more sensitive clinical indicator than QCT measurements for evaluating adult-onset EA.
Acknowledgements
Author Contributions
We thank all the authors for their contributions. Z.L., J.Z., and J.T. designed the study. Z.L., B.K., G.S., T.H., and N.H. collected and analyzed the data. Z.L. drafted the manuscript. All authors reviewed and approved the final version.
Funding
This work was supported by the National Health and Family Planning Commission of China [grant number 201402013].
Conflicts of Interest
The authors declare that there is no conflict of interest.
Institutional Review Board Statement
This study was conducted following the Declaration of Helsinki and was approved by the local ethics committee (The First Affiliated Hospital of Xi’an Jiaotong University, approval number: KYLLSL201312202). Informed consent was obtained from all subjects involved in the study.
Data Availability
All data generated or analyzed during this study are included in the article. The data underlying this study are available from the corresponding author upon reasonable request.
References
1. Varricchi G, Brightling CE, Grainge C, Lambrecht BN, Chanez P. Airway remodelling in asthma and the epithelium: on the edge of a new era. Eur Respir J 2024; 63(4): 2301619. doi: 10.1183/13993003.01619-2023
2. Flinkman E, Vähätalo I, Tuomisto LE et al. Association Between Blood Eosinophils and Neutrophils With Clinical Features in Adult-Onset Asthma. J Allergy Clin Immunol Pract 2023; 11(3): 811-821.e5. doi: 10.1016/j.jaip.2022.11.025
3. Hussain M, Liu G. Eosinophilic Asthma: Pathophysiology and Therapeutic Horizons. Cells 2024; 13(5): 384. doi: 10.3390/cells13050384
4. Kuo CS, Pavlidis S, Zhu J et al. Contribution of airway eosinophils in airway wall remodeling in asthma: Role of MMP-10 and MET. Allergy 2019; 74(6): 1102-1112. doi: 10.1111/all.13727
5. Klein M, Dijoux E, Dilasser F et al. Nouveaux acteurs dans la physiopathologie de l’asthme [New protagonists in asthma pathophysiology]. Presse Med 2019; 48(3 Pt 1): 255-261. French. doi: 10.1016/j.lpm.2019.01.004
6. Venge P. The eosinophil and airway remodelling in asthma. Clin Respir J 2010; 4 Suppl 1: 15-19. doi: 10.1111/j.1752-699X.2010.00192.x
7. Boulet LP. Airway remodeling in asthma: update on mechanisms and therapeutic approaches. Curr Opin Pulm Med 2018; 24(1): 56-62. doi: 10.1097/MCP.0000000000000441
8. Kim S, Lee CH, Jin KN, Cho SH, Kang HR. Severe Asthma Phenotypes Classified by Site of Airway Involvement and Remodeling via Chest CT Scan. J Investig Allergol Clin Immunol 2018; 28(5): 312-320. doi: 10.18176/jiaci.0265
9. Januskevicius A, Gosens R, Sakalauskas R et al. Suppression of Eosinophil Integrins Prevents Remodeling of Airway Smooth Muscle in Asthma. Front Physiol 2017; 7: 680. doi: 10.3389/fphys.2016.00680
10. de Groot JC, Ten Brinke A, Bel EH. Management of the patient with eosinophilic asthma: a new era begins. ERJ Open Res 2015; 1(1): 00024-2015. doi: 10.1183/23120541.00024-2015
11. Dávila González I, Moreno Benítez F, Quirce S. Benralizumab: A New Approach for the Treatment of Severe Eosinophilic Asthma. J Investig Allergol Clin Immunol 2019; 29(2): 84-93. doi: 10.18176/jiaci.0385
12. Menzies-Gow A, Hoyte FL, Price DB et al. Clinical Remission in Severe Asthma: A Pooled Post Hoc Analysis of the Patient Journey with Benralizumab. Adv Ther 2022; 39(5): 2065-2084. doi: 10.1007/s12325-022-02098-1
13. de Groot JC, Storm H, Amelink M et al. Clinical profile of patients with adult-onset eosinophilic asthma. ERJ Open Res 2016; 2(2): 00100-2015. doi: 10.1183/23120541.00100-2015
14. FitzGerald JM, Bleecker ER, Nair P et al. Benralizumab, an anti-interleukin-5 receptor α monoclonal antibody, as add-on treatment for patients with severe, uncontrolled, eosinophilic asthma (CALIMA): a randomised, double-blind, placebo-controlled phase 3 trial. Lancet 2016; 388(10056): 2128-2141. doi: 10.1016/S0140-6736(16)31322-8
15. Genofre E, Carstens D, DeBacker W et al. The effects of benralizumab on airway geometry and dynamics in severe eosinophilic asthma: a single-arm study design exploring a functional respiratory imaging approach. Respir Res 2023; 24(1): 121. doi: 10.1186/s12931-023-02415-4
16. Ortega HG, Liu MC, Pavord ID et al. Mepolizumab treatment in patients with severe eosinophilic asthma. N Engl J Med 2014; 371(13): 1198-1207. doi: 10.1056/NEJMoa1403290
17. Domvri K, Tsiouprou I, Bakakos P et al. Effect of mepolizumab in airway remodeling in patients with late-onset severe asthma with an eosinophilic phenotype. J Allergy Clin Immunol 2025; 155(2): 425-435. doi: 10.1016/j.jaci.2024.10.024
18. Krings JG, Goss CW, Lew D et al. Quantitative CT metrics are associated with longitudinal lung function decline and future asthma exacerbations: Results from SARP-3. J Allergy Clin Immunol 2021; 148(3): 752-762. doi: 10.1016/j.jaci.2021.01.029
19. Obojski A, Patyk M, Zaleska-Dorobisz U. Assessment of airway remodeling by quantitative computed tomography at various degrees of asthma severity defined according to the Global Initiative for Asthma report: a single-center study. Pol Arch Intern Med 2022; 132(3): 16152. doi: 10.20452/pamw.16152
20. Patyk M, Obojski A, Sokołowska-Dąbek D, Parkitna-Patyk M, Zaleska-Dorobisz U. Airway wall thickness and airflow limitations in asthma assessed in quantitative computed tomography. Ther Adv Respir Dis 2020; 14: 1753466619898598. doi: 10.1177/1753466619898598
21. Kitaguchi Y, Shomura T, Suzuki Y et al. Novel Tracheal Parameters Based on Quantitative Computed Tomography Assessment Reflecting Pulmonary Function and Eosinophilia in Patients With Asthma Who Demonstrate Persistent Airflow Obstruction: A Retrospective Observational Cross-Sectional Study. Health Sci Rep 2025; 8(7): e71084. doi: 10.1002/hsr2.71084
22. Global Initiative for Asthma. Global Strategy for Asthma Management and Prevention 2020; Available from: https://www.ginasthma.org
23. Inoue H, Ito I, Niimi A et al. CT-assessed large airway involvement and lung function decline in eosinophilic asthma: The association between induced sputum eosinophil differential counts and airway remodeling. J Asthma 2016; 53(9): 914-921. doi: 10.3109/02770903.2016.1167903
24. Alagha K, Jarjour B, Bommart S et al. Persistent severe hypereosinophilic asthma is not associated with airway remodeling. Respir Med 2015; 109(2): 180-187. doi: 10.1016/j.rmed.2014.12.008
25. Tsubokawa F, Koya T, Murai Y et al. Effects of Benralizumab on Three-Dimensional Computed Tomography Analysis in Severe Eosinophilic Asthma. Int Arch Allergy Immunol 2023; 184(3): 243-251. doi: 10.1159/000525846
26. Begueret H, Berger P, Vernejoux JM, Dubuisson L, Marthan R, Tunon-de-Lara JM. Inflammation of bronchial smooth muscle in allergic asthma. Thorax 2007; 62(1): 8-15. doi: 10.1136/thx.2006.062141
27. Montaudon M, Lederlin M, Reich S et al. Bronchial measurements in patients with asthma: comparison of quantitative thin-section CT findings with those in healthy subjects and correlation with pathologic findings. Radiology 2009; 253(3): 844-853. doi: 10.1148/radiol.2533090303
28. Backman H, Lindberg A, Hedman L et al. FEV1 decline in relation to blood eosinophils and neutrophils in a population-based asthma cohort. World Allergy Organ J 2020; 13(3): 100110. doi: 10.1016/j.waojou.2020.100110
29. Zhang XY, Simpson JL, Powell H et al. Full blood count parameters for the detection of asthma inflammatory phenotypes. Clin Exp Allergy 2014; 44(9): 1137-1145. doi: 10.1111/cea.12345
30. Yap E, Chua WM, Jayaram L, Zeng I, Vandal AC, Garrett J. Can we predict sputum eosinophilia from clinical assessment in patients referred to an adult asthma clinic? Intern Med J 2013; 43(1): 46-52. doi: 10.1111/j.1445-5994.2011.02565.x
31. Wagener AH, de Nijs SB, Lutter R et al. External validation of blood eosinophils, FE(NO) and serum periostin as surrogates for sputum eosinophils in asthma. Thorax 2015; 70(2): 115-120. doi: 10.1136/thoraxjnl-2014-205634
32. Kerkhof M, Tran TN, Soriano JB et al. Healthcare resource use and costs of severe, uncontrolled eosinophilic asthma in the UK general population. Thorax 2018; 73(2): 116-124. doi: 10.1136/thoraxjnl-2017-210531 33. Mäkelä MJ, Christensen HN, Karlsson A, Rastogi S, Kettunen K. Health care resource utilization and characteristics of patients with eosinophilic asthma in secondary health care in Finland. Eur Clin Respir J 2018; 5(1): 1458560. doi: 10.1080/20018525.2018.1458560