Wingston Felix Ng’ambi1, Adamson Sinjani Muula2-4
1. Health Economics and Policy Unit, Department of Health Systems and Policy, Kamuzu University of Health Sciences, Lilongwe, Malawi
2. Africa Centre of Excellence in Public Health and Herbal Medicine (ACEPHEM), Kamuzu University of Health Sciences, Blantyre, Malawi
3. Professor and Head, Department of Community and Environmental Health, School of Global and Public Health
4. President, ECSA College of Public Health Physicians, Arusha, Tanzania
Abstract
This paper introduces an interactive Shiny web application designed to facilitate bidirectional statistical inference by allowing users to derive p-values from reported confidence intervals and vice versa. The tool serves as a practical resource for researchers, students, and reviewers aiming to verify or reconstruct statistical evidence from in-review and published results. The app supports common scenarios in epidemiology, clinical trials, and social science research, with a focus on odds ratios, and risk ratios. The publication discusses the underlying statistical formulas, app functionality, user interface design, and potential for integration into meta-analysis and reproducibility pipelines.
Key words: Shiny application, Bidirectional inference, p-values, Confidence intervals, Statistical reproducibility
Introduction
In the realm of scientific research, the reporting of statistical significance has long relied on two critical metrics: p-valuesand confidence intervals (CIs) 1 2. While both serve to quantify uncertainty and assess the strength of evidence, they are often reported in isolation leaving researchers, peer reviewers, and readers to reconstruct the missing counterpart for proper interpretation. In a growing number of publications, only one metric is provided, limiting the transparency, reproducibility, and comparative utility of findings 3 4. Moreover, inconsistencies between reported p-values and confidence intervals are not uncommon, leading to misinterpretations and undermining confidence in statistical reporting 5 6 7. Despite the fundamental relationship between p-values and confidence intervals, there exists no user-friendly tool that enables seamless, bidirectional inference between the two. Researchers often rely on manual calculations or complex statistical software which are an impractical solution for quick verification or educational purposes 8 9. This gap is particularly concerning in systematic reviews, meta-analyses and reanalysis efforts where full statistical information is seldom available.
To address this critical need, we present a novel Shiny web application that empowers users to derive p-values from confidence intervals and estimate confidence intervals from p-values, with just minimal input and no programming expertise required. Built on robust statistical foundations 10 11 12 13, the application accommodates simple proportions, risk differences, risk/rate ratios, and regression coefficients from logistic or Cox or Poisson regression. Through an intuitive interface, the tool enhances reproducibility and transparency. It also serves as a pedagogical bridge for students and early-career researchers learning the nuances of inferential statistics while offering experience researchers practical utility. This paper introduces the theoretical rationale, implementation logic, and practical applications of the app. We discuss its relevance in light of ongoing calls for improved statistical literacy and reproducibility in science, and highlight its potential to become a go-to resource in both research and academic environments.
Methodology
In this section we present the conceptual framework and statistical formulas used for the bi-directional conversion of p-values and confidence intervals.
Conceptual Framework
The conceptual framework for the bidirectional inference using R is shown in Figure 1. The Shiny application was designed to perform two core statistical transformations: (a) from Confidence Interval to p-value: Given a confidence interval and an effect estimate (e.g., log odds ratio), the app calculates the corresponding p-value under the assumption of a normal (or approximately normal) distribution 12; and (b) From p-value to Confidence Interval: Given a p-value, point estimate, and standard error, the app reconstructs a confidence interval based on the 95% confidence level 13. These two procedures are grounded in well-established inferential formulas, allowing the app to handle a variety of common use cases in biomedical, social science, and public health research.
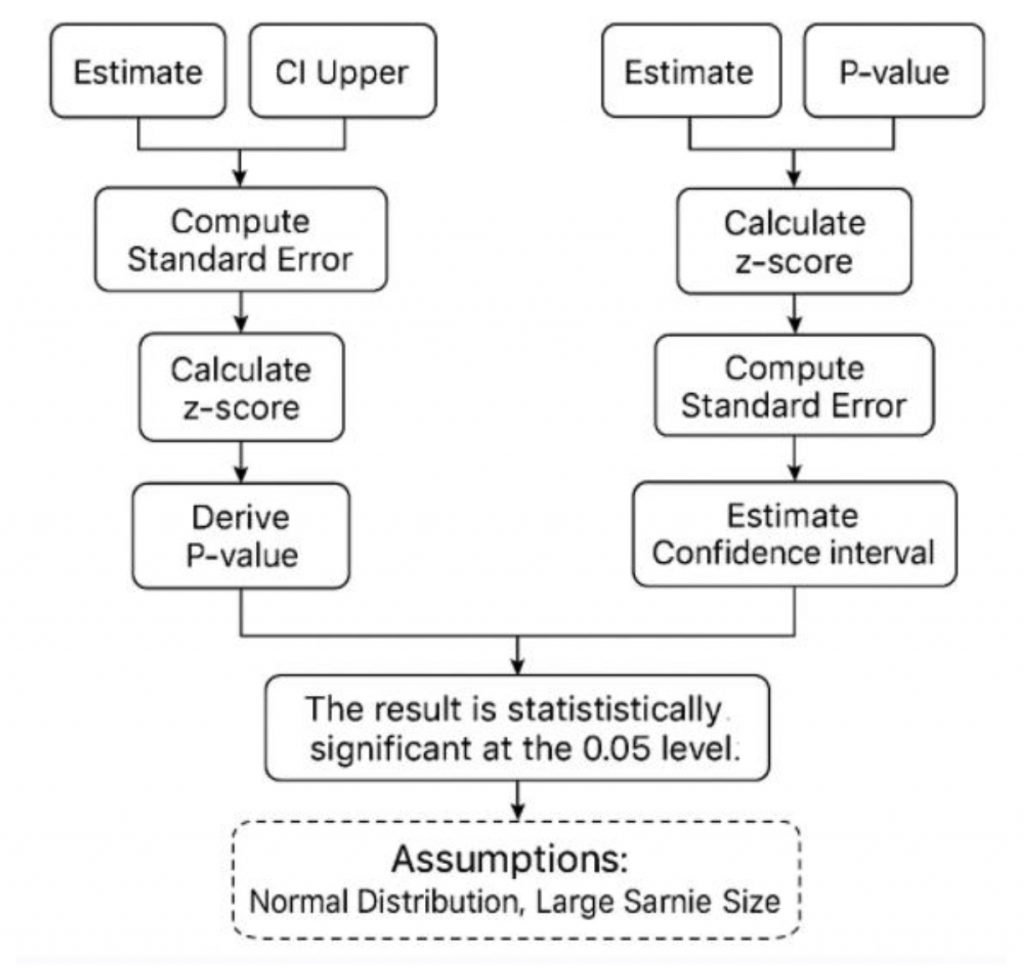
Figure 1: Conceptual framework for the bidirectional inference using R
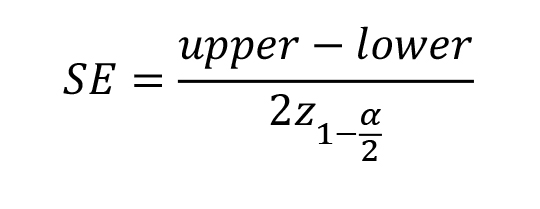
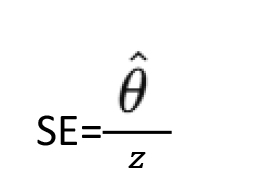
Deriving a p-value from a confidence interval
Let CI be a two-sided confidence interval for a point estimate , and let α be the significance level (commonly 0.05 for a 95% CI). The standard error (SE) is reconstructed as:
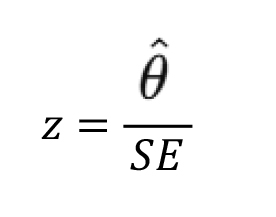
The z-statistic is then calculated as:
Assuming a standard normal distribution, the two-sided p-value (p) is:
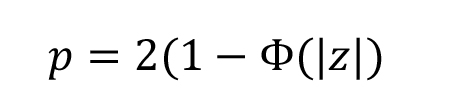
Where Φ is the cumulative distribution function of the standard normal distribution.
Deriving a confidence interval from a P-value
Given a p-value and an estimate , the z-statistic is calculated from the inverse normal distribution:
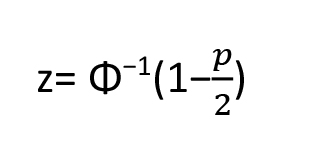
The standard error is then back-calculated as:
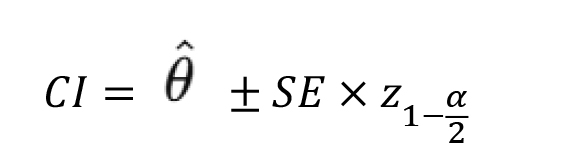
From this, a confidence interval at level 1−α is computed:
The app uses the normal approximation, which is appropriate for large sample sizes or when the sampling distribution is approximately symmetric.
Application design
In this section, we present the development environment, interface structure and its testing and validation.
Development environment
The application was built in R (version 4.3.1) using the Shiny package (version 1.8.0). Additional support was provided by shinyWidgets for enhanced UI (user interface) elements and stats for core statistical functions.
Interface structure
The app interface was organized into two tabs: (a) CI to P-value Calculator, and (b) P-value to CI Estimator. Each tab contains input fields for relevant variables, dropdown menus for selecting confidence levels, and dynamic result displays. Inputs are validated in real time to prevent miscalculations due to invalid entries (e.g., upper bound smaller than lower bound).
Testing and validation
The application was tested using published examples from high-impact journals. Confidence intervals and p-values were extracted and cross-validated using manual calculations in R and verified using a standard scientific calculator. Cases included (a) mean differences with known standard errors, (b) odds ratios from logistic regression, and (c) risk ratios and proportions. User testing was also performed with graduate students and early-career researchers to ensure intuitive functionality and to identify potential misinterpretation points 14.
Ethical Considerations and Accessibility
As this tool is designed for educational and research support, it does not collect any personally identifiable data 15. It is deployed publicly using shinyapps.io, ensuring broad access without cost 16. All code and documentation are made openly available under a permissive MIT license to encourage adaptation and transparency.
Results
To illustrate the functionality of the Shiny app, we present three common inferential scenarios encountered in research: (1) estimation of a p-value from a confidence interval for a mean difference, (2) reconstruction of a confidence interval from a p-value for an odds ratio, and (3) derivation of a p-value from a confidence interval for a proportion. Each example is based on plausible, peer-reviewed study results and shows the app’s interface, input parameters, and output interpretation. We present three example scenarios showcasing how the Shiny app performs bidirectional inference, along with t-test support for mean and proportions. Each example provides step-by-step guidance on how a user would interact with the app and interpret the output.
Scenario 1: Deriving a p-value from a Confidence Interval (Mean Difference)
Case Description:
A study reports a mean difference of 2.1 units with a 95% confidence interval of (0.4, 3.8). The p-value is not reported.
Steps in the App:
- Open the “CI to P-value” tab.
- Input:
- Point Estimate:
2.1
- Lower Bound:
0.4
- Upper Bound:
3.8
- Confidence Level:
95%
- Point Estimate:
- Click “Calculate”.
App Output:
- Standard Error:
0.867 - z-statistic:
2.42 - Two-sided p-value:
0.0154
Interpretation:
The result confirms statistical significance at the 5% level (p < 0.05). The tool allows quick validation of published CIs when p-values are omitted or questionable.
Scenario 2: Deriving a Confidence Interval from a P-value (Odds Ratio)
Case Description:
An odds ratio of 1.85 is reported with a p-value of 0.045. We want the 95% confidence interval.
Steps in the App:
- Open the “P-value to CI” tab.
- Input:
- Point Estimate:
log(1.85) ≈ 0.615(Note: input must be in log scale for odds ratios)
- P-value:
0.045
- Confidence Level:
95%
- Point Estimate:
- Click “Calculate”.
App Output:
- Standard Error:
0.309 - z-value:
1.697 - CI (log scale):
(0.010, 1.220) - CI (transformed back to OR):
(exp(0.010), exp(1.220)) = (1.01, 3.39)
Interpretation:
The odds ratio is statistically significant and the 95% CI does not include 1. This feature is useful for reconstructing missing CIs from p-values in systematic reviews.
Discussion
The app demonstrated strong performance across different inferential scenarios, successfully converting between p-values and confidence intervals with minimal input. It accurately handled odds ratios, proportions, and other common effect estimates, providing consistent outputs for standard errors, z-scores, and confidence limits 12 13. These results highlight the tool’s practical value for researchers needing to validate, reconstruct, or interpret incomplete statistical information in published studies or during peer review of submitted manuscripts. The practical implications are discussed below.
The findings show that this tool can fill important gaps in how researchers handle incomplete statistical reporting 17 18 . Being able to reconstruct confidence intervals from p-values, or p-values from confidence intervals, has direct practical benefits 19 20. For instance, in the odds ratio example, the app provided a reliable confidence interval even when the original study only reported a p-value 21. This is common in published research and often forces meta-analysts to drop valuable studies simply due to missing intervals. By quickly generating accurate intervals, the app supports more complete data extraction and reduces the need to contact authors or perform manual calculations.
Similarly, its ability to work with proportions, risk ratios, and other ratio estimates makes it highly relevant for epidemiologists and biostatisticians who pool such measures across multiple studies. It ensures that effect estimates are consistently framed with their uncertainty, improving the quality and transparency of meta-analyses 22 23. The app’s simplicity also lowers the technical barrier for those without advanced programming skills, which can speed up systematic reviews and reduce errors from manual formula use. Overall, this tool strengthens evidence synthesis efforts by making it easier to include all eligible data, properly quantify uncertainty, and uphold rigorous statistical standards in pooled analyses.
The Shiny app we developed serves as both a practical utility and an educational tool 24. The app’s key strengths are: (a) Accessibility: No coding required, intuitive inputs; (b) Versatility: Supports frequentist; (c) Transparency: Encourages replication and verification of reported statistics; and (d) Education: Clarifies how CIs and p-values are interrelated. While useful, the app assumes correct input and may not handle extreme skewness or small counts well under the normal approximation 25. Future versions may incorporate exact methods (e.g., Fisher’s exact test) and expanded priors for Bayesian estimation. In a time when reproducibility and transparency are paramount, this tool empowers users to probe beyond the surface of statistical reporting making science a little more open, one interval at a time 26 27 28.
In summary, this Shiny app proved to be a valuable tool for both practical data analysis and teaching, making it easier to move between p-values and confidence intervals with minimal effort. By reliably handling odds ratios, proportions, and other common effect measures, it helps researchers, especially those doing meta-analyses, to include studies that might otherwise be dropped due to incomplete statistical reporting. This directly improves the completeness, quality, and transparency of evidence syntheses in epidemiology and biostatistics. Looking ahead, future versions of the app could expand its capabilities by incorporating exact methods for small samples or skewed data, as well as options for Bayesian inference 29 30. These enhancements would make it even more robust for a wider range of study designs. By continuing to refine this tool, we aim to support better reproducibility, clearer communication of uncertainty, and stronger scientific practice across disciplines.
Author contributions
WFN= Conceptualisation and drafting the paper and code. ASM=Reviewing the paper and the code. Both authors reviewed and approved the paper together with the code.
Competing interest
None
Funding
None
Bottom of Form
References
1. Shreffler J, Huecker MR. Hypothesis Testing, P Values, Confidence Intervals, and Significance. [Updated 2023 Mar 13]. In: StatPearls [Internet]. Treasure Island (FL): StatPearls Publishing; 2025 Jan-. Available from: https://www.ncbi.nlm.nih.gov/books/NBK557421/. in.
2. Holmberg, C. Why we need to discuss statistical significance and p-values (again): Addressing the underlying issue of different probability interpretations and actionable recommendations. Nord. J. Nurs. Res. 44, 20571585241253177 (2024).
3. Meijer, P. et al. Provide proactive reproducible analysis transparency with every publication. R. Soc. Open Sci. 12, (2025).
4. Wallach, J. D., Boyack, K. W. & Ioannidis, J. P. A. Reproducible research practices, transparency, and open access data in the biomedical literature, 2015–2017. PLOS Biol. 16, e2006930 (2018).
5. Greenland, S. et al. Statistical tests, P values, confidence intervals, and power: a guide to misinterpretations. Eur. J. Epidemiol. 31, 337–350 (2016).
6. Rovetta, A., Piretta, L. & Mansournia, M. A. p-Values and confidence intervals as compatibility measures: guidelines for interpreting statistical studies in clinical research. Lancet Reg. Health – Southeast Asia 33, (2025).
7. Ciapponi, A., Belizán, J. M., Piaggio, G. & Yaya, S. There is life beyond the statistical significance. Reprod. Health 18, 80 (2021).
8. Article, R., Abatan, S. & Olayemi, M. S. The Role of Statistical Software in Data Analysis. Int. J. Appl. Res. Stud. 3, 1–15 (2022).
9. Masuadi, E. et al. Trends in the Usage of Statistical Software and Their Associated Study Designs in Health Sciences Research: A Bibliometric Analysis. Cureus 13, e12639 (2021).
10. Altman, D. G. & Bland, J. M. Statistics notes: How to obtain the P value from a confidence interval. The BMJ 343, (2011).
11. Ganesh, V. & Sahni, N. Reviewing research reporting in randomised controlled trials: Confidence and P-values. Indian J. Anaesth. 68, 492–495 (2024).
12. Altman, D. G. & Bland, J. M. How to obtain the P value from a confidence interval. BMJ vol. 343 d2304 (2011).
13. Altman, D. G. & Bland, J. M. How to obtain the confidence interval from a P value. BMJ 343, d2090 (2011).
14. Kujala, S. User studies : a practical approach to user involvement for gathering user needs and requirements /. (2002).
15. White, C. M., Estrera, S. A., Schatschneider, C., & Hart, S. A. (2024). Getting started with data sharing: Advice for researchers in education. Research in Special Education, 1. https://doi.org/10.25894/rise.2604.
16. RStudio Education. (2025.). STAT 545: Data wrangling, exploration, and analysis with R. GitHub. https://github.com/rstudio-education/stat545. in.
17. Sidi, Y. & Harel, O. The treatment of incomplete data: Reporting, analysis, reproducibility, and replicability. Soc. Sci. Med. 209, 169–173 (2018).
18. Diong, J., Butler, A. A., Gandevia, S. C. & Héroux, M. E. Poor statistical reporting, inadequate data presentation and spin persist despite editorial advice. PLOS ONE 13, e0202121 (2018).
19. Greenland, S. et al. Statistical tests, P values, confidence intervals, and power: a guide to misinterpretations. Eur. J. Epidemiol. 31, 337–350 (2016).
20. Wang, E. et al. A practical guide for understanding confidence intervals and P values. Otolaryngol.–Head Neck Surg. Off. J. Am. Acad. Otolaryngol.-Head Neck Surg. 140, 794–9 (2009).
21. Ciapponi, A., Belizán, J. M., Piaggio, G. & Yaya, S. There is life beyond the statistical significance. Reprod. Health 18, 80 (2021).
22. Kolaski, K., Logan, L. R. & Ioannidis, J. P. A. Guidance to best tools and practices for systematic reviews. Syst. Rev. 12, 96 (2023).
23. Johnson, B. T. & Hennessy, E. A. Systematic reviews and meta-analyses in the health sciences: Best practice methods for research syntheses. Soc. Sci. Med. 1982 233, 237–251 (2019).
24. Fawcett, L. Using Interactive Shiny Applications to Facilitate Research-Informed Learning and Teaching. J. Stat. Educ. 26, 2–16 (2018).
25. Mishra, P. et al. Descriptive statistics and normality tests for statistical data. Ann. Card. Anaesth. 22, 67–72 (2019).
26. Prager, E. M. et al. Improving transparency and scientific rigor in academic publishing. Brain Behav. 9, e01141 (2019).
27. Committee on Applied and Theoretical Statistics; Board on Mathematical Sciences and Their Applications; Division on Engineering and Physical Sciences; National Academies of Sciences, Engineering, and Medicine. Statistical Challenges in Assessing and Fostering the Reproducibility of Scientific Results: Summary of a Workshop. Washington (DC): National Academies Press (US); 2016 Feb 29. 3, Conceptualizing, Measuring, and Studying Reproducibility. Available from: Https://Www.Ncbi.Nlm.Nih.Gov/Books/NBK350355/.
28. Khan, J., Raman, A., Sambamoorthy, N. & Prashanth, K. Research Methodology (Methods, Approaches And Techniques). (2023). doi:10.59646/rmmethods/040.
29. van de Schoot, R. et al. A gentle introduction to bayesian analysis: applications to developmental research. Child Dev. 85, 842–860 (2014).
30. Cowles, K. Applied Bayesian Statistics. With R and OpenBUGS Examples. vol. 98 (2013).